ER Diagrams: Designing Before Building
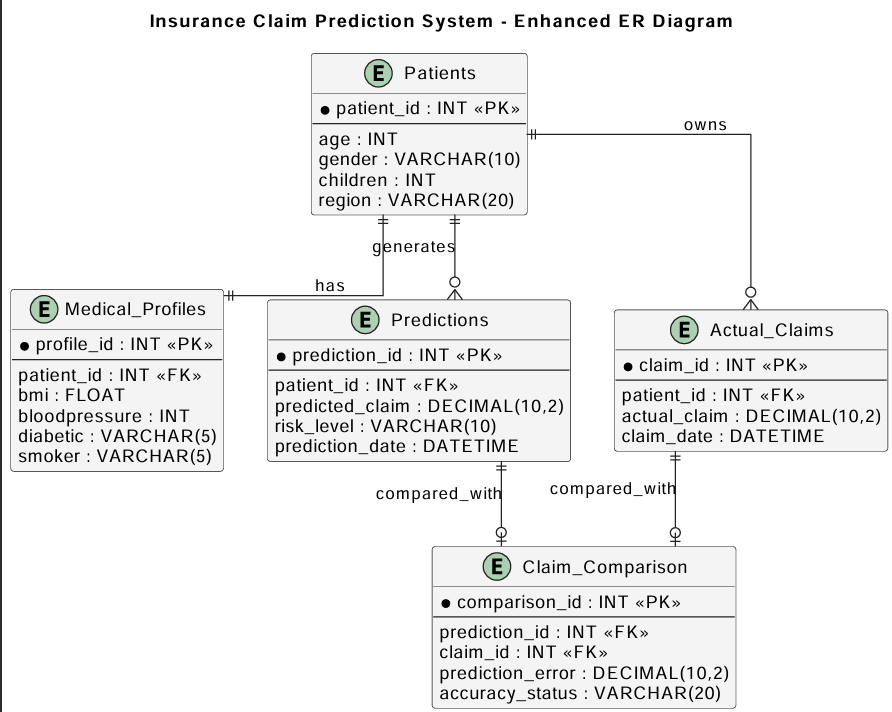
ER Diagrams: Designing Before Building
For the first few weeks of Database Systems, I jumped straight into writing CREATE TABLE statements whenever an assignment needed a new database. It worked, mostly, but every so often I would realize halfway through a project that my table structure did not actually support the kind of question I needed to ask later, and I would have to go back and redesign things. Entity-Relationship diagrams were introduced as the fix for exactly this problem, and once I started using them properly, that whole pattern of mid-project redesigns mostly disappeared.
The idea behind an ER diagram is simple on the surface: identify the “things” your system needs to keep track of, called entities, identify the meaningful attributes of each one, and then map out how those entities relate to each other before writing a single line of SQL. What took longer to appreciate was how much careful thinking that simple idea actually demands. Deciding whether something is its own entity or just an attribute of another entity is not always obvious, and getting it wrong early tends to cause problems much later.
A good example from one of our assignments involved modeling students, courses, and enrollments. My first instinct was to treat “enrollment” as just an attribute on the student table — a list of course names tied to each student. It took a diagram, and a fair amount of back-and-forth thinking, to realize that enrollment is actually its own relationship with information of its own, like enrollment date or grade, and that cramming it into the student table would make it impossible to represent a student taking multiple courses cleanly. Once I drew that relationship out explicitly — students connected to courses through an enrollment entity — the structure of the actual database tables became almost obvious, and the SQL practically wrote itself.
Working with cardinality was another part of ER diagrams that forced a different kind of thinking than I was used to from programming. Deciding whether a relationship is one-to-one, one-to-many, or many-to-many is not just a labeling exercise; it directly determines how the tables underneath need to be structured, and whether a foreign key belongs on one side of a relationship or whether an entirely separate linking table is needed. Getting this wrong does not usually cause an error message the way a syntax mistake does — it causes a database that technically works but cannot correctly represent real-world situations, which is a much harder kind of mistake to notice and fix later.
This is also where the connection between Database Systems and Dr. Bilal Ahmad’s broader interest in working with real, high-quality data became clearer to me. A carefully designed ER diagram is, in a sense, the first checkpoint for data quality — before any record is ever inserted, the structure itself is already deciding what kinds of relationships and constraints the data has to respect. The same discipline that makes a dataset trustworthy enough to train a reliable model starts at this design stage, long before any actual data exists.
Translating a finished ER diagram into actual SQL turned out to be far less stressful than designing the diagram itself. Once entities, attributes, relationships, and cardinalities were settled, converting them into CREATE TABLE statements with appropriate primary and foreign keys felt almost mechanical compared to the design decisions that came before it. That order of operations — think first, design on paper, then implement — was probably the single biggest shift in how I approach any data-related project now, including the machine learning work I did later in the semester, where understanding the structure of a dataset before touching any code saved me from several mistakes I might otherwise have made.
Looking back, ER diagrams taught me something that goes beyond databases specifically: most of the painful rework in any technical project comes from skipping the planning step because it feels slower than just starting to build. It rarely is. A diagram drawn in twenty minutes on paper saved me hours of restructuring tables later, and that trade-off is one I now actively look for in every new project, database-related or not.
Drawing several ER diagrams over the course of the semester also taught me to notice a kind of warning sign in my own thinking: whenever an attribute started to feel like it needed its own list, rather than a single value, that was usually a hint that I was looking at a hidden entity instead of a simple attribute. A student having multiple phone numbers, or a course having multiple prerequisites, both looked at first like minor details that could be squeezed into a single column with commas separating the values. Each time, working through the diagram properly showed why that shortcut breaks down quickly — a single column crammed with multiple values cannot be searched, filtered, or related to anything else cleanly, while a separate linked entity handles the same situation correctly from the start.
Weak entities were a smaller but genuinely tricky concept that took extra attention to fully understand. An entity that cannot be uniquely identified without referring to another entity it depends on — like an order item that only makes sense in the context of a specific order — required a different notation in the diagram and a different approach in the resulting table design, usually involving a composite key built from the related entity’s identifier. It felt like a minor technical detail at first, but getting it wrong in an assignment produced a structure that allowed duplicate or orphaned records that should never have been possible, which made the importance of the distinction very concrete.
I also found it useful to deliberately try drawing the same system two different ways before settling on a final diagram. The first attempt at modeling students, courses, and enrollments often felt reasonable until I tried to imagine actually querying it for something specific, like “list every course a given student is enrolled in along with their grade.” Walking through that imagined query against the diagram, before writing any SQL, exposed gaps that were not obvious just from looking at the entities and relationships in isolation. That habit of mentally testing a design against realistic questions before building it became one of the most useful checks I picked up from this part of the course.
By the time the semester reached its later database assignments, sketching an ER diagram before opening MySQL had become an automatic first step rather than an extra chore imposed by an assignment rubric. That shift, more than any specific notation or symbol, is what I consider the real outcome of learning ER diagrams properly.
What surprised me most was how much disagreement is possible even on a fairly simple diagram. Working through a couple of these exercises with classmates, I noticed that two people could look at the exact same set of requirements and draw genuinely different, both reasonably valid, entity-relationship diagrams. There is rarely a single “correct” diagram in the way there is a single correct answer to a SQL syntax question; there are better and worse designs depending on what the system actually needs to do well, and recognizing that ambiguity changed how confidently I treated my own first draft.
I also found it useful to deliberately stress-test a finished diagram with a few “what if” questions before treating it as final. What if a student needs to retake the same course twice — does the current relationship still make sense? What if a course is cancelled after students have already enrolled — does anything break? Walking through scenarios like these on paper, before any table existed, caught a handful of weaknesses in my early designs that would have been far more annoying to fix after the database was already built and partially filled with data. That habit of questioning a design before trusting it is, in many ways, the same instinct SQL later taught me to apply to queries themselves.